Explain Stress Strain Diagram - Elastic Limit, Yield Point, Ultimate Stress, Breaking Stress
For designing machine parts, it is crucial to know how the material function in service. For this purpose, certain mechanical characteristics of material is determined from a standard tensile test. This is a destructive test that consists of gradually loading the specimen material and noting the corresponding change in the specimen's length and diameter until it fractures. This test is done by a universal testing machine (UTM).
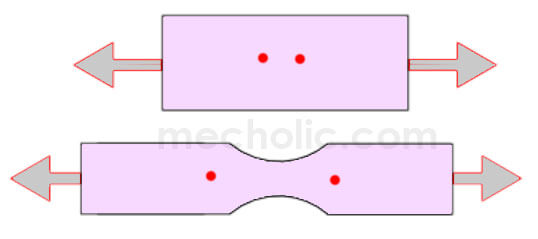
The UTM tensile testing machine will gradually apply and determine the load on the material specimen. Before applying a load, two reference point is marked on the specimen. This length is known as gauge length. The machine starts loading the material. When the machine applies enough load, the specimen starts to elongate and reduce diameter (or cross sectional area). The machine will load the specimen until it breaks. The stress is measured by dividing load value by the cross-sectional area of specimen material. The amount of that two-reference point moved apart helps to determine elongation. The strain is determined by dividing elongation by original gauge length.
Stress-strain curve gives the relation between stress and strain of engineering material. This plot will provide the material's mechanical properties to the machine designer, such as the Young's modulus, the yield strength. The following figure is showing a stress-strain diagram of low carbon steel material.
Proportional limit
The proportional limit is the stress at which the stress-strain curve begins to deviate from a straight line. From the diagram, we can see that the line OA is straight. Which means until point A the stress is directly proportional to strain. So, the first stage OA is a linear elastic region. Beyond point A the diagram deviates slightly from the straight line. So, Hooke’s law holds good up to the point A. This point is known as the proportional limit.
Elastic limit
At the beginning stage of load testing, the specimen will regain its original shape and size when the load is removed. The test shows that, even beyond the proportional limit (point A) up to certain point B, the material will regain its shape and size. Which means the material hold its elastic properties until point B. The stress corresponding to this point is known as the elastic limit.
The proportional limit and elastic limit are very close to each other, so these two are taken as equal in normal cases.
Yield point
When loaded beyond the elastic limit, the material enters its plastic stage. At the beginning of the plastic stage, the strain increases at fast rate with stress. Up to a particular point C there will be significant strain without any increase in stress. In case of mild steel, immediately after yielding commence, there will be a small drop in stress to D. the point C and D are two yield points known as upper and lower yield point respectively. The stress at these points is known as yield point stress.
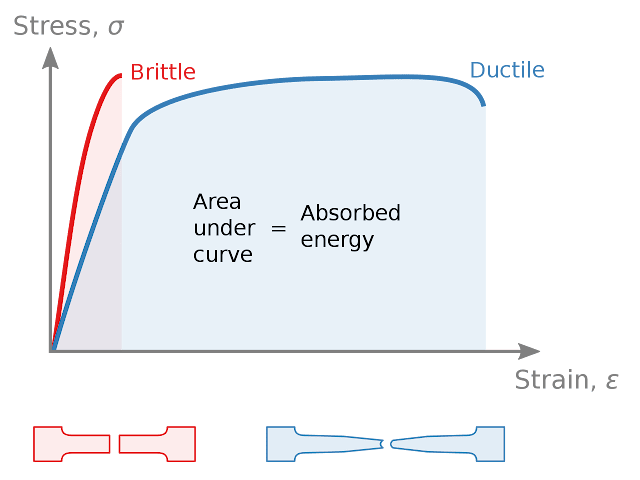
Unlike the ductile material, the brittle material rupture occurs before without any noticeable elongation. Sometimes it fractures before reaching yield point. Such a brittle material like glass, carbon fiber, concrete, etc. do not have well-defined yield point.
Ultimate stress
At lower yield point, the specimen regains some strength. Beyond point D higher stress is required for higher strain, than those between proportional limit A and yield point D. stress on specimen increases until it reaches its maximum value E known Ultimate stress. The second stage of elongation from yield point to ultimate tensile strength is known as strain hardening region.
Breaking stress
After reaching ultimate stress, a neck is formed in specimen and cross-sectional area of the specimen also decreases. This region is known as necking region. The experiment shows that the stress required to break away the specimen is less than Ultimate stress. The stress beyond ultimate stress E reduces until it breakaway at point F. This point is known as breaking stress.
Percentage elongation
It is a measurement of the percentage of increase in gauge length by measuring a fractured specimen length by bringing broken part together.
Percentage reduction in area
It is the expression of difference in the original cross-sectional area of specimen and neck after it fractures. It is expressed in percentage
Since the neck formation decreases the cross-sectional area of the specimen, the plot from ultimate stress E to breaking stress F in somewhat misleading. From E to F if we measure the true tensile stress by dividing load by reduced cross-sectional area neck part, the stress-strain curve actually follows the dotted line EG.


